
You spent the last 20 to 30 years growing your business. After months of work, due diligence, negotiation, and sleepless nights you finally sold it! You look at the bank balance and it almost doesn’t seem real to you yet. However, now you have a new dilemma to solve. You can’t sit in cash forever while your purchasing power is eroded by inflation. Yet, “the market” feels too risky. What if markets are at an all-time high? What about investing during a decline or high volatility? What’s the best way to convert your cash into stock related to your long-term allocation strategy to support your financial plan?
There are two common ways to get capital into the market: Dollar-cost averaging vs. lump sum. Lump-sum investing gets all the cash invested all at once. Dollar-cost averaging (DCA) gradually gets cash invested into the market over a specific period of time.
The Basics of Dollar-Cost Averaging vs. Lump Sum
Let’s take a hypothetical situation. You recently sold your business and, after setting aside your tax liability, you have $12,000,000 earmarked for investment. Instead of buying $12,000,000 in stocks today, an investor going the DCA route buys $1,000,000 worth of stocks each month for the next 12 months.
If the market increases in value each month during this period, the DCA investor will pay a higher price on average than if investing all up front. If the market decreases steadily over the next 12 months, the opposite will be true. Though people often believe that dollar-cost averaging reduces risk, empirical evidence suggests it might merely mean taking risk later.
While investors may focus on the prices paid for these installments of asset purchases, it’s important to remember that, unlike with the lump-sum approach, a meaningful portion of the investor’s capital is remaining in cash rather than gaining exposure to the stock market. With interest rates so low, the cash will earn close to nothing. During the process of capital deployment in this hypothetical example, half of the investable assets on average are forfeiting the higher expected returns of the stock market. For investors with the goal of accumulating wealth, this is potentially a big opportunity cost.
Despite the drawbacks of dollar-cost averaging, people may be hesitant to plunk down all their investable money at once in a lump sum. If markets have recently hit all-time highs, investors may wonder whether they have already missed the best returns and so ought to wait for a pullback before getting into the market. Conversely, if stocks have just fallen and news reports suggest more declines could be on the way, some investors might take that as a signal that waiting to buy is the wiser course.
Driving the similar reactions to these very different scenarios is one fear: What if I make an investment today and the price goes down tomorrow?
Exhibit 1
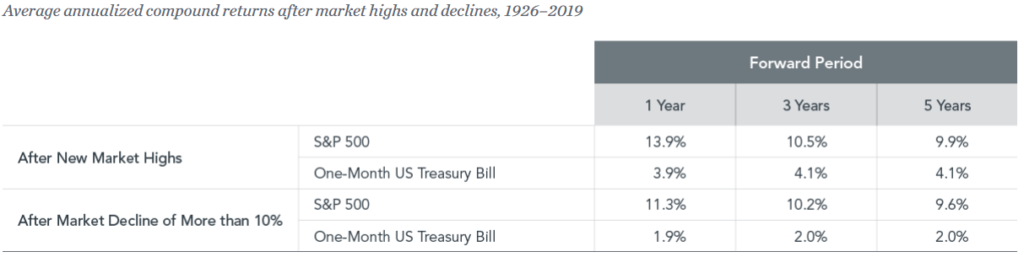
Exhibit 1 puts those fears in a broader context. It shows the average annualized compound returns of the S&P 500 from 1926–2019. After the index has hit all-time highs, the subsequent one-, three-, and five-year returns are positive, on average. After the S&P 500 has fallen more than 10%, the subsequent one-, three-, and five-year returns are also positive, on average. Both data sets show returns that outperform those of one-month Treasury bills.
Overall, the data do not support the notion that recent market performance should influence the timing of investing in stocks.
Empirical Evidence Comparing the Approaches
Vanguard research published a study that explored dollar-cost averaging vs. lump sum, looking at return data in the U.S. from 1928–2011 (85 years). The study found that lump-sum investing beat DCA 67% of the time. Equivalent results were also found when investigating the strategies in the United Kingdom and Australia. Intuitively, that makes sense when we reflect upon the fact that from 1926–2019 stocks outperformed the risk-free rate (30-day treasury) 70% of the time over a one-year period.
Though the arithmetic of the decision is easy to prove, implementation can be much more difficult.
Nobel laureate Daniel Kahneman has helped us better understand the often invisible emotions we experience that directly impact our financial decisions. For example, in 1979, Kahneman’s research discovered loss aversion: ”Losses loom larger than gains.” It’s thought that the pain of losing is psychologically about twice as powerful as the pleasure of gain.
For a lot more information about behavior biases that negatively impact investors, check out our white paper on the subject.
One Size Does Not Fit All
Both theory and data suggest that lump-sum investing is the more efficient approach to building wealth over time. However, dollar-cost averaging is better than not investing at all. DCA could make sense for an investor with a lower risk tolerance. Not all decisions are merely financial decisions.
The global stock market has offered a high average return historically, and those returns can be an important ally in helping investors realize their goals. Getting cash into stocks, whether gradually or all at once, puts the investor in position to reap the potential benefits.
Delap Wealth Advisory can help investors decide which approach — dollar-cost averaging vs. lump-sum investing — is better for them. What’s clear is that markets have rewarded investors over time. Whichever method one pursues, the goal is the same: developing a plan and sticking with it.
Original Sources:
Dimensional Fund Advisors: Perspectives Blog
Vanguard: Dollar-cost averaging just means taking the risk later
GRAPH DISCLOSURE: Past Performance doesn’t guarantee future results. In US dollars. New market highs are defined as months ending with the market above all previous levels for the sample period. Annualized compound returns are computed for the relevant time periods subsequent to new market highs and averaged across all new market high observations. Declines are defined as months ending with the market below the previous market high by at least 10%. Annualized compound returns are computed for the relevant time periods after each decline observed and averaged across all declines for the cutoff. There were 1,127 observation months in the sample. January 1990–present: S&P 500 Total Returns Index. S&P data © 2020 S&P Dow Jones Indices LLC, a division of S&P Global. All rights reserved. January 1926–December 1989; S&P 500 Total Return Index, Stocks, Bonds, Bills and Inflation Yearbook™, Ibbotson Associates, Chicago. For illustrative purposes only. Index is not available for direct investment; therefore, its performance does not reflect the expenses associated with the management of an actual portfolio. “One-Month US Treasury Bills” is the IA SBBI US 30 Day TBill TR USD, provided by Morningstar. There is always a risk that an investor may lose money.
Stocks vs. 30 Day Treasury: Indices are not available for direct investment. Index returns are not representative of actual portfolios and do not reflect costs and fees associated with an actual investment. Based on monthly rolling differences in annualized returns over the periods listed. Rolling multiyear periods overlap and are not independent. Indices are not available for direct investment. Index returns are not representative of actual portfolios and do not reflect costs and fees associated with an actual investment. “One-Month Treasury Bills” is the IA SBBI US 30 Day TBill TR USD, provided by Morningstar. S&P data © 2020 S&P Dow Jones Indices LLC, a division of S&P Global. All rights reserved. See “Index Descriptions” in the appendix for descriptions of Dimensional and Fama/French index data.
The information in this document is provided in good faith without any warranty and is intended for the recipient’s background information only. It does not constitute investment advice, recommendation, or an offer of any services or products for sale and is not intended to provide a sufficient basis on which to make an investment decision. It is the responsibility of any persons wishing to make a purchase to inform themselves of and observe all applicable laws and regulations.